2014 Business Highlights
Here are some of our highlights from 2014, which was another year of extraordinary achievement. You can see the full timeline of our key milestones since 2000 here.
- For the third year, Great Place to Work® names Pinnacle one of the best workplaces in the United States on its 2014 Best Small & Medium Workplaces list. Pinnacle ranked No. 5 out of 25 on the medium-sized list, which was published in FORTUNE magazine.
- American Banker names Pinnacle one of the “Best Banks to Work For” in the U.S. for the second year. Pinnacle was No. 2 among the 40 banks listed.
- Pinnacle receives national and regional Greenwich Excellence Awards for the fourth consecutive year for overall satisfaction in small business banking, middle market banking and treasury management. Greenwich Associates evaluated more than 750 banks based on client feedback and only the top five percent received the Excellence Awards.
- Pinnacle receives Greenwich Best Brand Awards in small business banking based on trust and ease of doing business. Greenwich Associates evaluated more than 750 banks, and only 20 were found to have distinctive brands.
- Nashville Business Journal ranks Pinnacle Middle Tennessee’s No. 1 small business lender for the fifth consecutive year.
- The Knoxville Area Urban League honors Pinnacle with the 2014 Corporate Leadership Award at its annual Equal Opportunity Awards Gala. The award recognizes a company that has shown special support of the Urban League’s mission.
- Pinnacle is named to DepositAccounts.com’s list of the “Top 200 Healthiest Banks in America.” The report rates every federally insured bank in the U.S.—more than 6,500—on a number of factors and recognizes the top 200 who have shown exceptional fiduciary responsibility.
- Pinnacle is recognized for its financial performance in Sandler O’Neill + Partners’ annual Sm-All Stars report for the fourth time. Pinnacle is the only Tennessee bank among the nation’s 35 best-performing small-cap institutions based on growth, profitability, asset quality and capital strength.
- Pinnacle earns the highest ranking among Tennessee banks in Bank Director magazine’s 2014 Bank Performance Scorecard in the $5–50 billion asset range.
- Pinnacle remains the fourth-largest financial institution in the Nashville-Davidson-Murfreesboro MSA, according to June 2014 FDIC data. Pinnacle maintains the No. 6 share in the Knoxville MSA, holds the top spot in Rutherford County and is the third-largest in Wilson County, two of the most attractive counties in the state.
Financial Highlights
| For the year ended December 31, | 2013 | 2012 | 2011 | 2010 | 2009 |
| Consolidated statements of income data: | |||||
| Net revenues (in thousands) | $4,140,858 | $3,661,088 | $3,479,375 | $3,113,486 | $2,749,505 |
| Total expenses (in thousands) | $3,849,555 | $3,410,497 | $3,196,690 | $3,202,335 | $2,676,938 |
| (Loss) Income from operations (in thousands) | $291,303 | $250,591 | $282,685 | $(88,849) | $72,567 |
| Net (loss) income (in thousands) | $181,857 | $151,918 | $170,382 | $(56,862) | $47,520 |
| Per-share data: | |||||
| (Loss) Earnings per diluted share | $1.72 | $1.37 | $1.50 | $(0.64) | $0.47 |
| Weighted average diluted share outstanding (in thousands) | 106,003 | 111,060 | 112,119 | 100,933 | 98,494 |
| Consolidated statements of financial condition data: | |||||
| Cash and cash equivalents (in thousands) | $516,584 | $466,261 | $720,772 | $419,208 | $378,594 |
| Total assets (in thousands) | $4,042,831 | $3,988,524 | $3,816,326 | $3,646,167 | $3,336,936 |
| Total debt (in thousands)1 | $1,535,096 | $1,317,825 | $1,332,668 | $1,386,639 | $1,369,223 |
| Other financial and operating data: | |||||
| Adjusted EBITDA (in thousands)2 | $511,438 | $454,482 | $459,720 | $413,113 | $356,068 |
| Adjusted Earnings (in thousands)2 | $258,805 | $225,029 | $218,585 | $172,720 | $129,556 |
| Adjusted Earnings per share3 | $2.44 | $2.03 | $1.95 | $1.71 | $1.32 |
| Gross Margin (in thousands)4 | $1,248,014 | $1,112,251 | $1,030,951 | $937,933 | $844,926 |
| Number of advisors | 13,673 | 13,352 | 12,847 | 12,444 | 11,950 |
| Advisory and brokerage assets (in billions) | $438.4 | $373.3 | $330.3 | $315.6 | $279.4 |
| Advisory assets under management (in billions) | $151.6 | $122.1 | $101.6 | $93.0 | $77.2 |
| Average number of full-time employees | 3,047 | 2,865 | 2,687 | 2,517 | 2,430 |
(1) Total debt consists of our senior secured credit facilities, senior unsecured subordinated notes, revolving line of credit facility and bank loans payable.
(2) Represents Adjusted earnings divided by weighted average number of shares outstanding on a fully diluted basis.
(3) Gross margin is calculated as net revenues less production expenses. Production expenses consist of the following expense categories from our consolidated statements of operations:
(i) commissions and advisory fees and (ii) brokerage, clearing and exchange. All other expense categories, including depreciation and amortization, are considered general and administrative in nature. In 2010, upon closing our IPO in the fourth quarter, the restriction on approximately 7.4 million shares of common stock issued to our advisors under the Fifth Amended and Restated 2000 Stock Bonus Plan was released. Accordingly, we recorded a share-based compensation charge of $222.0 million in the fourth quarter of 2010, representing the offering price of $30.00 per share multiplied by 7.4 million shares. This charge has been classified as production expense in 2010. Gross margin as calculated for 2010 above, does not include this charge for comparability purposes with previous years shown.
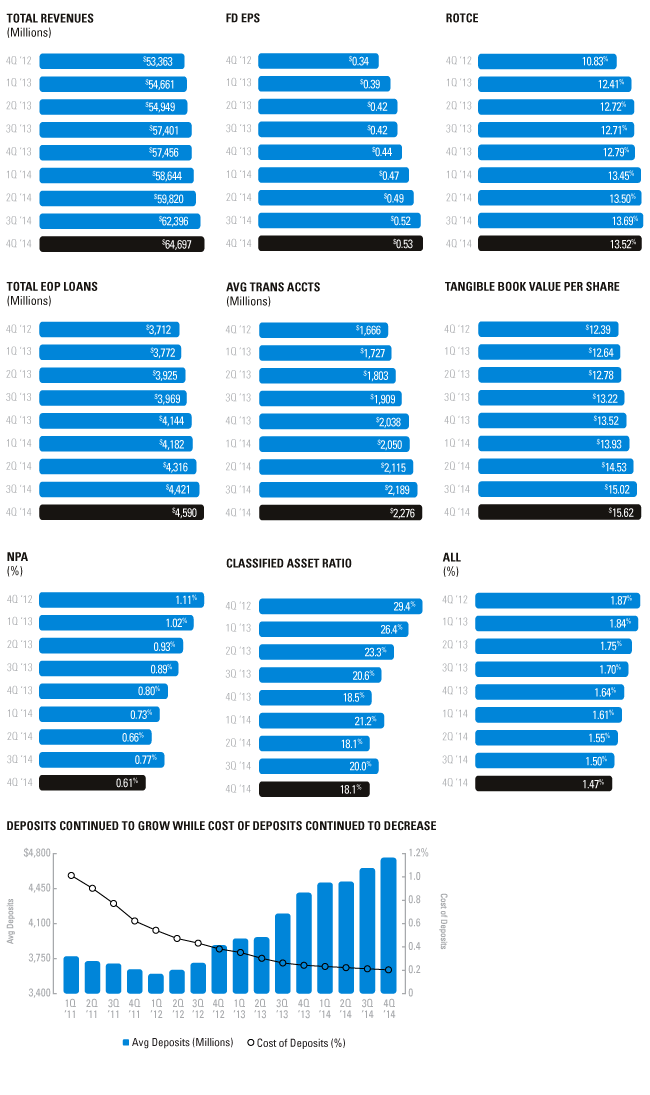
Charting Our Performance